The original text was written in French and published by FIPECO on 05.12.2024. Read the original version here.
“Tax expenditures” are legislative or regulatory provisions that deviate from a reference “tax norm or benchmark”, and result in a loss of budget revenue. In France, they are sometimes referred to as “tax loopholes” when they concern personal income tax or corporate income tax. This note first focuses on the tax expenditures listed in the Finance Bill (FB) for 2025 and their evolution since 2017. It then discusses tax expenditures in other countries.
The list annexed in September 2016 to the FB for 2017 listed 451 tax expenditures and the list annexed to the PLF for 2024 includes 474.
Estimating the cost of tax expenditures is often difficult, and the FB for 2025 provides estimates for only 387 provisions, and only an order of magnitude for 125 of them.
As a result of a highly questionable change in methodology, the cost of VAT-related tax expenditures was reduced by around €10bn in the FB for 2024. The Cour des Comptes (the Audit Office) recommended that the Ministry of Finance (MoF) reverts to the old methodology, but this recommendation was ignored in the FB for 2025.
Using the old methodology for VAT-related tax expenditures, one can estimate the amount of tax expenditure (excluding the CICE, which was replaced in 2019 by reductions in employers’ social security contributions) at €75.3bn in 2017 and €95.0bn in 2023. It would thus have risen from 3.3% of GDP in 2017 to 3.4% in 2023.
In a 2022 note and on the basis of official national reports on tax expenditures, the IMF estimates their total cost at around 4% of GDP in countries that publish such reports. The Council on Economic Policies (CEP) and the German Institute of Development and Sustainability (IDOS), has compiled a database with the information found in these reports in 218 jurisdictions. It is clear that international comparisons are challenging because of the different benchmark tax systems and since the scope and quality of these reports are very heterogeneous.
Tax expenditure is a grey area in public policy everywhere. CEP and IDOS has constructed an index of the transparency based on these official reports, for which France ranks third out of the 105 assessed countries. The information published in France is open to criticism, but the situation is worse in most other countries.
To continue to shed light on tax expenditure provisions, CEP and IDOS has begun publishing a series of Tax Expenditure Country Reports (TECRs) written by national experts. The first TECR presents the case of the Netherlands and the third one focuses on France. I am the author of the latter, and it has just been published online.
A) Tax expenditures in France
Further information on tax expenditure in France can be found in a fact sheet on this site.
1) The number of tax expenditures
To determine whether or not a legislative or regulatory provision constitutes a tax expenditure, the applicable tax standard from which it could derogate must be defined.
Defining this reference or benchmark system is sometimes difficult because it is based on concepts of taxation that are the subject of debate and can change. The question of whether, for example, the “quotient familial“, used to adjust income tax according to the size of the household, is or is not a tax expenditure, can be debated at length without any consensual conclusion being reached. In practice, tax expenditures are defined as the provisions listed in Volume II of the Report on Ways and Means appended each year to the FB.
This list is debatable, but there is no other. Moreover, the Ministry of Finance sometimes removes provisions from the list, even though they still exist, and adds measures that already existed.
Tax expenditures takes a variety of forms. The main ones are exemptions, allowances, deductions, reduced rates, additional half-parts of the “quotient familial” (but not the “normal” half-parts), reductions and tax credits.[1]
There were 451 tax expenditures listed in September 2016 in the report appended to the FB for 2017 and 474 in September 2024 in the report appended to the FB for 2025. The number of provisions has therefore increased since 2017.
The number of tax expenditures
| 2017 FB | 2018 FB | 2019 FB |
2020 FB | 2021 FB |
2022 FB |
2023 FB |
2024 FB |
2025 FB |
| 451 | 457 | 474 | 468 | 475 | 471 | 465 | 467 | 474 |
Source: Reports appended to the Finance Bills
The information contained in the Ways and Means reports does not make it simple to accurately count the creation and elimination of tax expenditures, nor the additions to the list of measures that already existed and the deletions of measures that still exist. In addition, a tax expenditure may be abolished by a FB and still appear on the list several years later because it continues to have a budgetary impact. The Competitiveness and Employment Tax Credit (CICE), for example, is still on the PLF 2025 list because of residual reimbursements to companies despite its abolition in 2019.
2) The cost of tax expenditures
a) Methodological difficulties
Volume II of the Ways and Means Report appended to the PLF 2024 presents the budgetary cost of 387 tax expenditures (out of 474), and the sum of these costs. The accuracy of the total cost of tax expenditures therefore depends on the accuracy of this list, and on the division between those tax expenditures that can be quantified and those which cannot (this said, the largest provisions are always quantified). These uncertainties are compounded by the fragility of the methods used to estimate the revenue forgone stemming from tax expenditures.
As it is often very difficult to estimate the impact of tax expenditures on taxpayers’ behaviour, their fiscal cost is always calculated on the assumption that taxpayers’ behaviour does not change as a result of these measures.
Under these conditions, the cost of tax credits is easy to assess. All one needs to do is take taxpayers’ returns and add up the tax credits that are claimed and granted.
It is more difficult to estimate the cost of tax reductions, as the amount is capped by the amount of tax due before the reduction. It is possible, however, to simulate the cost using a representative sample, or on the basis of all tax returns, as is the case for the cost of an allowance, a deduction or an additional half-rate.
Exempt income, activities or assets are rarely included in tax returns and it is often very difficult, if not impossible, to estimate their fiscal cost. One needs to estimate the exempt amount on the basis of other tax data or statistics such as the national accounts, and then to apply the tax rate to which it would have been subject if it had not been exempt, which is not always easy.
It is not easy to estimate the cost of a reduced VAT rate applied to a particular activity, as it is not generally possible to calculate it on the basis of business’ returns. It is therefore not estimated on the basis of tax returns but on the basis of consumption statistics. However, these statistics do not allow us to measure with sufficient accuracy the amount of certain very specific purchases that benefit from a reduced rate.
Of the 387 tax expenditures quantified in the FB for 2025, only an order of magnitude is provided for 125 of them.
b) The change of method in the FB for 2024
The cost of VAT-related tax expenditures has been reduced from around €20bn in previous FBs to around €10bn in the FB for 2024, on the grounds that the national government transfers half of the proceeds of VAT to social and local administrations and that the cost of tax expenditures corresponds only to that borne by the national government.
This change in the methodology is highly questionable. In fact, as shown in a previous FIPECO note, the cost of these measures is indeed borne by the national government. In addition, the total cost to the government as a whole is indeed around €20bn, and it is this amount that is most relevant. Moreover, this new methodology is not applied to other taxes partially transferred to subnational authorities, which is inconsistent. Finally, as the MoF does not publish a series of tax expenditure figures estimated using this new methodology for previous years, the costs of tax expenditures published in the 2024 FB and in those previous budgets are not comparable.
In its report on the State budget in 2023, the Cour des Comptes (French State Audit Office) pointed out that the interpretation of tax expenditures was “blurred” by this “questionable” change of convention and recommended that the MoF reverts to the previous methodology. In the report appended to the FB 2025, the MoF nevertheless maintained its new approach.
In the remainder of this note, unless otherwise stated, the cost of VAT-related tax expenditures for the general government is used. The amounts given for these measures and for the total cost of tax expenditures are therefore different from those published in the FB for 2025.
c) The cost of tax expenditures in 2023
In 2023, the cost of tax expenditures amounts to €96.1bn (compared with €82.9bn in the FB using the new methodology for calculating VAT-related tax expenditure). Excluding the CICE, it is €95.0bn.
The main concerned taxes are the personal income tax (€38.7bn), taxes on both household income and corporate profits (industrial and commercial, agricultural and non-commercial profits) (€14.0bn), the corporate income tax (€9.2bn), the VAT (€24.3bn), and the excise duty on energy products (€6.2bn).
The largest tax expenditures are : the tax credit for research (€7.3bn), the tax credit for employing home workers (€6.1bn), the replacement of the corporate income tax by a flat-rate levy based on ship tonnage for shipping companies (€5.6bn), the 10% rebate on pensions (€4,5bn), the reduced VAT rate applied to housing maintenance work excluding energy renovation (€4.5bn), the reduced VAT rate for on-site catering (€4.2bn), the reduced rates applied in the French overseas departments (€4.0bn), and the exemption of sums paid under profit-sharing, incentive schemes or employee savings schemes (€2.7bn).
The government’s “green budget” is constructed by rating budgetary expenditure and tax expenditure according to their impact on the environment. Brown tax expenditures, i.e. those with a negative environmental impact, are estimated at €7.5bn, compared with €3.4bn for those with a positive or mixed impact.
d) Long-term trends
Sometimes measures are removed from the list of tax expenditures, even though they still exist, and others are added at a certain point in time, even when they already existed. In addition, the costing methods have sometimes changed. The trend of the fiscal cost shown in the reports appended to successive FBs must therefore be corrected to present changes in tax expenditure on a constant format (scope and methods), which has been done in this note to obtain a series that is consistent with the list in the FB for 2025.
This said, the resulting trend should be treated with caution because, in addition to the intrinsic fragility of the estimates, it is also affected to a certain (and undetermined) extent by changes in the methodology used to calculate specific measures (e.g. use of new sources).
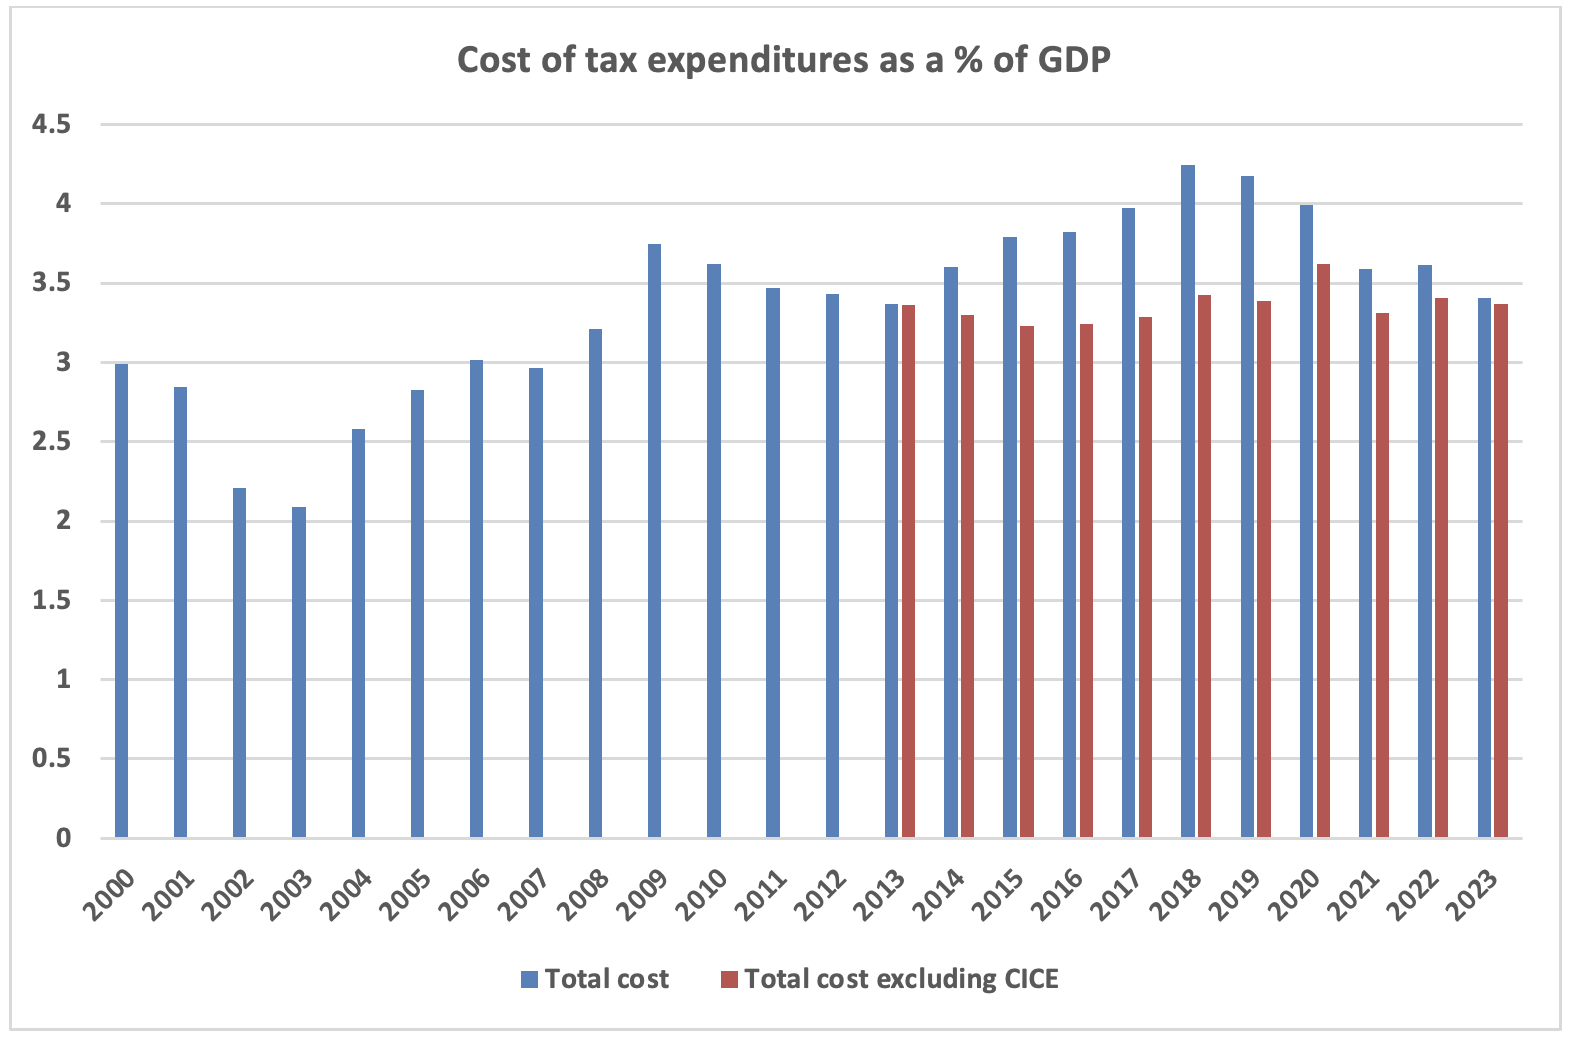
Source: reports appended to the Finance Bills (the costs shown in the 2024 and 2025 Finance Bills for 2022 and 2023 have been corrected to include the total cost of VAT-related tax expenditure); FIPECO.
Subject to these reservations, the cost of tax expenditures rose sharply between 2003 and 2009 as a percentage of GDP, mainly due to tax credits, which coincide with the introduction of restrictive standards for budget spending. This was followed by a decline in their cost until 2013. A further increase is observed from 2014. This is mainly due to the implementation of the CICE, but not exclusively, as the cost of tax expenditure excluding the CICE also increases from 2016 onwards. Excluding the peak in 2020, which is mainly due to the fall in GDP, the cost of tax expenditure excluding the CICE has stabilized at 3.3 / 3.4% of GDP since 2017.
B) Tax expenditure in other countries
The “tax expenditure” concept appeared in budget documentation in the United States and Germany at the end of the 1960s and, since then, more and more countries have started to report on tax expenditures. Tax expenditures are defined everywhere as deviations from benchmark tax norms or a benchmark tax structure.
1) The work of the European Commission and the IMF
In the European Union, a 2011 directive requires Member States to provide information on their tax expenditure to the European Commission. The Commission’s 2014 report highlighted the some of the methodological difficulties discussed above. It also showed that there were two groups of countries when it came to personal income tax- and corporate income tax-related tax expenditures: in the first group, which included Italy, Spain and the United Kingdom; tax expenditures represented between 5% and 8% of GDP. In the second group, which included France, Germany and the Netherlands; they only represented between 1% and 3% of GDP. However, the report did not specify to what extent these differences were explained by the definition of the benchmark tax system, which greatly hinders the relevance of these comparisons.
In November 2022, the IMF published a note on the tax expenditure evaluation. This note shows that, according to national estimates and with all the reservations mentioned above, tax expenditures represented on average around 4% of GDP in countries, whether advanced or not, tax expenditure reporting was conducted. While France is around the average for this indicator, it ranks second regarding the number of tax expenditure provisions listed between 2016 to 2018 (behind Greece).
2) The work of the Council on Economic Policies (CEP)
The Council on Economic Policies (CEP), a think tank based in Switzerland, has undertaken major analyses of tax expenditure policy across countries. In partnership with the German Institute of Development and Sustainability (IDOS), it has set up an online Tax Expenditures Lab, which hosts the Global Tax Expenditures Database (GTED) and the Global Tax Expenditures Transparency Index (GTETI). It also regularly organises regional and international meetings on tax expenditures.
The GTED covers 218 jurisdictions and has information on over 27,000 tax expenditure provisions. The information in the database comes from official reports published by governments. While the GTED provides a basis for analysis and debate in the field, it also shows that international comparisons can be challenging. First, because the benchmarks are highly heterogeneous; and second, since the quality (e.g. of the revenue forgone estimates, etc.) and scope (scope limited to the State or extended to other public administrations, scope limited to certain taxes or covering all compulsory tax expenditures) of the official reports can vary significantly from country to country. It also appears that governance (e.g. regarding the procedure to create or abolish tax expenditures, the frequency and scope of evaluations, etc.) can also often be very different across countries.
The GTETI ranks countries according to tax expenditure reporting practices, and aggregates the scores awarded to each country based on five dimensions, which are in turn, broken down into 5 indicators each: accessibility of data (visibility, frequency, etc.); governance (legal basis for reports, submission to Parliament, etc.); scope of official publications (coverage of specific taxes or all taxes, etc.); content of these publications (revenue forgone estimates, policy objectives, etc.); evaluation of tax expenditures (frequency of evaluations, etc.). Of the 105 assessed countries by the GTETI, France ranks fifth, behind South Korea, Indonesia, Canada and Germany. Although the quality of the information published in France is open to criticism (see above), the picture is bleaker in most other countries. Indeed, tax expenditure is everywhere a grey area in public policy, where many measures benefitting particular categories of households or businesses can be found and deserve far more scrutiny.
Against this backdrop, and in order to continue to improve information on tax expenditure and to mitigate the comparability issues between countries mentioned above, CEP has recently launched a series of country reports written by national experts, the Tax Expenditure Country Reports (TECRs). The first TECR, published in July 2024, focuses on the Netherlands and was written by a former Deputy Director of Tax Legislation at the Dutch Ministry of Finance. It shows that the fiscal cost of tax expenditure in this country lies between 8% or 15% of GDP, depending on the definition of the benchmark tax system. The difference between these two estimates is mainly explained by an “earned income tax credit” that can be classified as a tax expenditure or as part of the benchmark tax system. In France, such a policy would roughly correspond to a combination of the family allowance, the income tax rebate, the RSA and the activity allowance.
A second TECR, published in October 2024, focuses on India. The third one focuses on France, and I am the author (see the French version here and the English version here).
[1]A tax reduction cannot exceed the amount of tax due before the reduction. A tax credit may exceed it and, where applicable, the difference between the tax credit and the tax due is reimbursed by the State to the taxpayer.