This commentary was first published by Finances Publiques et Economie (FIPECO) in French
“Tax expenditures” are legislative or regulatory provisions that derogate from a reference “tax norm” and result in revenue forgone. They are sometimes referred to as “tax loopholes” when they concern personal income tax or corporate income tax (the two expressions are used here with the same meaning). This note first presents the tax expenditures listed in the draft finance bill (PLF) for 2026 and their evolution since 2017. It then reviews tax expenditures in other countries.
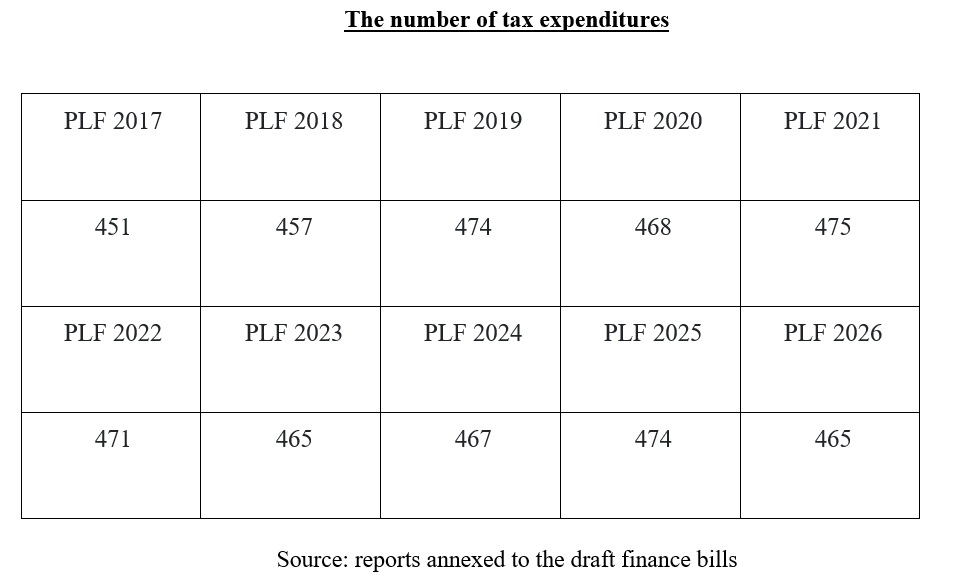
The list annexed to the PLF for 2017 identified 451 tax expenditures, while the list annexed to the PLF for 2026 identifies 465.
Estimating their cost is often difficult, and the PLF for 2026 provides figures for only 408 tax expenditures. For 124 of them, these figures are only orders of magnitude.
As a result of a questionable change in methodology, the cost of VAT-related tax expenditures was reduced by around €10 billion in the PLF for 2024. The Cour des comptes (French Court of Auditors) recommended that the Ministry of Finance revert to the former methodology, but this recommendation was ignored in the PLF for 2026.
Using the former methodology for VAT-related measures, the amount of tax expenditures, which stood at €75.3 billion in 2017, exceeded €100 billion in 2024, reaching €101.4 billion. It thus increased from 3.3% of GDP in 2017 to 3.5% in 2024.
In a 2022 note, and on the basis of official national reports on tax expenditures, the IMF estimated their total cost at around 4% of GDP in countries that publish such reports. A think tank based in Switzerland, the Council on Economic Policies (CEP) together with the German Institute of Development and Sustainability (IDOS), compiled a database using the information found in these reports across 218 jurisdictions. This shows that international comparisons are very difficult, as reference tax norms as well as the scope and quality of these reports are highly heterogeneous.
Tax expenditures constitute a blind spot in public policy everywhere, but CEP and IDOS have developed a transparency indicator for these reports, in which France ranks eighth out of the 116 countries assessed. The information published in France is open to criticism, but the situation is worse in most other countries.
To continue shedding light on these mechanisms, CEP and IDOS have begun publishing country reports written by national experts. The first report focuses on the Netherlands and the third on France.
A) Tax expenditures in France
Additional information on tax expenditures in France can be found in a factsheet on the FIPECO website.
1) The number of tax expenditures
To determine whether a legislative or regulatory provision does or does not constitute a tax expenditure, it is necessary to define the applicable reference tax norm from which it may derogate.
Defining this reference norm is sometimes difficult, as it refers to conceptions of taxation that are debated and may evolve. The question of whether, for example, the “family coefficient” (“quotient familial”, in French), used to adjust personal income tax according to household size, is or is not a tax loophole can be debated at length without any consensual conclusion being reached. In practice, tax loopholes are considered to be the measures listed in Volume II of the “Ways and Means” (“voies et moyens”) report annexed each year to the draft finance bill (“Projet de Loi de Finances”, or PLF), even though this list is open to debate.
It also happens that the Ministry of Finance removes measures from this list even though they still exist, and adds measures that already existed previously.
Tax expenditures take various forms. The main ones are exemptions, allowances, deductions, reduced rates, additional half-parts of the family coefficient (but not the “standard” half-parts), tax reductions tax credits[1].
There were 451 tax expenditures identified in September 2016 in the report annexed to the PLF for 2017, and 465 in September 2025 in the report annexed to the PLF for 2026. The number of tax loopholes has therefore increased slightly since 2017.
The information contained in the “Ways and Means” reports does not make it easy to count the creation and abolition of tax loopholes, nor the addition to the list of measures that already existed and the removal of measures that still exist. Moreover, a tax loophole may be abolished by a finance law and still appear on the list several years later because it continues to generate a budgetary cost. The tax credit for competitiveness and employment (CICE) thus still appears on the list annexed to the PLF for 2026 because of residual reimbursements to firms despite its abolition in 2019.
2) The cost of tax expenditures
a. Methodological difficulties
Volume II of the “Ways and Means” report annexed to the PLF for 2026 presents the budgetary cost of 408 tax loopholes (out of 465) and the sum of these costs. The reliability of the total cost of tax loopholes therefore depends on the relevance of the list and on the distinction between tax expenditures that can be quantified and those that cannot (the most significant ones are, however, always quantified). The fragility of the estimation methods adds to these sources of uncertainty.
As it is often very difficult to estimate the impact of tax measures on taxpayers’ behaviour, their budgetary cost is always calculated on the assumption that such behaviour does not change as a result of these measures.
Under these conditions, the cost of tax credits is easy to assess. It is sufficient to use taxpayers’ returns and total the tax credits they claim and that are granted to them.
Estimating the cost of tax reductions is more difficult, as their amount is capped by the tax due before the reduction. It is nevertheless possible to do so by carrying out simulations on a representative sample or on the full set of tax returns, as for the cost of an allowance, a deduction or an additional half-share.
Exempt income, activities or assets are rarely reported in tax returns, and estimating their cost is often very difficult, if not impossible. It is necessary to estimate the exempt amount on the basis of other tax data or statistics such as national accounts, and then apply the tax rate to which it would have been subject had it not been exempted, which is not always straightforward.
Estimating the cost of a reduced VAT rate applied to a specific activity is not easy because companies’ returns generally do not allow it to be calculated. It is therefore not estimated on the basis of tax returns but on the basis of consumption statistics. These statistics do not, however, make it possible to measure with sufficient accuracy the amount of certain very specific purchases that benefit from a reduced rate.
Of the 408 tax loopholes for which a cost estimate is provided in the PLF for 2026, the stated figure is merely an order of magnitude for 124 of them.
b. The methodological change in the draft finance bill for 2024
The cost of VAT-related tax expenditures was reduced from around €20 billion in previous PLFs to around €10 billion in the PLF for 2024, on the grounds that the State transfers half of VAT revenue to social security and local administrations and that the cost of tax expenditures corresponds only to the share borne by the State.
This change in methodology is highly questionable. Indeed, as shown in a previous note, the cost of these tax expenditures is in fact borne by the State. Moreover, the cost for all public administrations combined is indeed around €20 billion, and this is the most relevant figure. In addition, this new methodology is not applied to other taxes that are partially transferred to local authorities, which is inconsistent. Finally, since the Ministry of Finance has not published historical tax expenditure data for previous years estimated using this new methodology, the costs of tax expenditures shown in the PLFs for 2024 to 2026 and those shown in previous PLFs are not comparable.
In its report on the State budget for 2023, the Cour des comptes (French Court of Auditors) stressed that the reading of tax expenditures was “blurred” by this “questionable” change in convention and recommended that the Ministry of Finance revert to the previous convention. It reiterated this recommendation in its report on the 2024 budget. In the report annexed to the PLF for 2026, the Ministry of Finance nevertheless maintained its new convention[2].
In the remainder of this factsheet, unless otherwise stated, the cost of VAT-related tax expenditures for all public administrations combined is used. The amounts given for these measures and for the total cost of tax expenditures therefore differ from those shown in the PLF for 2026.
c. The cost of tax expenditures in 2024
In 2024, the cost of tax expenditures exceeded €100 billion for the first time, reaching €101.4 billion (compared with €89.4 billion in the PLF using the new methodology for calculating VAT-related tax expenditures). It increased by €5.3 billion compared with their cost in 2023 (€96.1 billion) and by €6.1 billion compared with the forecast for 2024 set out in the PLF for 2025, notably as a result of the upward revision of the cost of the partial exemption from inheritance tax in the case of business transfers, known as the “Dutreil pact”.
The main taxes concerned are personal income tax (€42.1 billion in 2024), taxes levied both on household income and on corporate profits (industrial and commercial profits, agricultural profits and non-commercial profits) (€14.1 billion), corporate income tax (€3.9 billion), VAT (€22.9 billion) and excise duties on energy products (€7.9 billion).
The most costly tax expenditures in 2024 are: the research tax credit (€7.8 billion), the tax credit for the employment of employees in the home (€6.4 billion), the partial exemption from transfer duties in the case of business transfers (€5.0 billion), the 10% allowance on pensions and retirement income (€4.8 billion), the reduced VAT rate applied to housing maintenance work excluding energy renovation (€4.6 billion), the reduced VAT rate applied to on-premises catering (€4.2 billion), and the exemption of sums paid under profit-sharing, employee share ownership or employee savings schemes (€2.9 billion).
d. Long-term trends
Measures are sometimes removed from the list of tax expenditures even though they still exist, while others are added even though they already existed previously. In addition, estimation methods have sometimes changed. The evolution of costs shown in the reports annexed to successive finance bills must therefore be adjusted in order to present trends in tax expenditures on a constant basis (scope and methods), which has been done here to obtain a series consistent with the list in the draft finance bill for 2026.
The resulting trends must nevertheless be interpreted with caution because, in addition to the intrinsic fragility of the estimates, they are affected to an indeterminate extent by changes in the estimation methods for certain specific measures (for example, the use of new data sources).
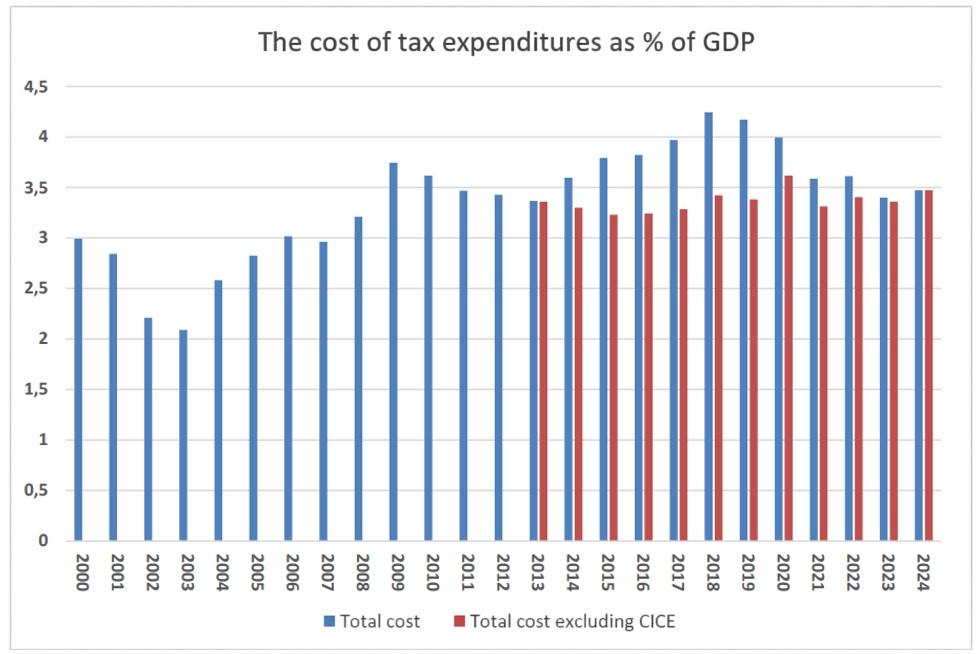
Sources: reports annexed to the draft finance bills (the costs shown in the PLFs for 2024 to 2026 for the years 2022 to 2024 have been adjusted to incorporate the total cost of VAT-related tax expenditures); FIPECO.
Subject to these caveats, there was a sharp increase in the cost of tax expenditures between 2003 and 2009, as a percentage of GDP, driven mainly by tax credits and coinciding with the introduction of binding rules on budgetary expenditure. A decline is then observed up to 2013. A new increase has been recorded since 2014. This rise is mainly due to the implementation of the CICE, but not exclusively, as the cost of tax expenditures excluding the CICE has also increased since 2016. Excluding the peak in 2020, which mainly reflects the fall in GDP, the cost of tax expenditures excluding the CICE rose slightly from 2017 (3.3% of GDP) to 2024 (3.5% of GDP).
B) Tax expenditures in other countries
The concept of “tax expenditures” emerged in the United States and Germany in the late 1960s in budgetary documentation, and many countries now publish reports on tax expenditures. They are defined everywhere as deviations from reference tax norms.
1. The work of the European Commission and the IMF
In the European Union, a 2011 directive required Member States to provide information on their tax expenditures to the European Commission. The report published by the Commission in 2014 recalled the methodological difficulties outlined above. It showed that two groups of countries could be distinguished with regard to tax expenditures related to income taxes and corporate profit taxes: in the first group, which included Italy, Spain and the United Kingdom in particular, they accounted for between 5% and 8% of GDP; in the second group, which included France, Germany and the Netherlands in particular, they accounted for only 1% to 3% of GDP. However, the report did not specify the extent to which the differences between these two groups were due to the definition of the reference norm, which greatly limits the relevance of these comparisons.
The IMF published a note in November 2022 on the evaluation of tax expenditures. It shows that, according to national estimates and subject to all the previous caveats, they represented on average around 4% of GDP in countries, whether advanced or not, that publish this information. While France is close to the average according to this indicator, it ranks second in terms of the number of tax expenditures identified over the period 2016–2018 (behind Greece).
2. The work of the Council on Economic Policies (CEP)
Major analytical work on tax expenditures worldwide has been undertaken by the Council on Economic Policies (CEP), a think tank based in Switzerland. In partnership with the German Institute of Development and Sustainability (IDOS), it has launched a Tax Expenditure Lab comprising a global database on tax expenditures (the Global Tax Expenditures Database, GTED) and a transparency indicator for official national reports on tax expenditures (the Global Tax Expenditures Transparency Index, GTETI). It also regularly organises international meetings and conferences on tax expenditures.
The database (GTED) covers 218 jurisdictions and more than 31,000 tax expenditures. The information it contains is drawn from official government publications. While it helps to inform analysis and debate, it also shows that international comparisons are very difficult. On the one hand, reference tax norms vary widely from one country to another; on the other hand, the quality (estimation of the cost of measures, etc.) and the scope (limited to central government or extended to other public administrations; limited to certain taxes or covering all compulsory levies) of official reports are highly heterogeneous. Governance arrangements (procedures for creating or abolishing measures, frequency and scope of evaluations, etc.) also often display national specificities.
The transparency index (GTETI) aggregates the scores assigned to each country for five criteria (themselves broken down into sub-criteria): data accessibility (format, frequency, etc.); governance (legal basis of reports, external controls, etc.); scope of official publications (specific taxes or all taxes, for example); descriptive information on tax expenditures included (policy objective, number of beneficiaries, etc.); and assessment of tax expenditures (budgetary cost, tax expenditure evaluations, etc.).
Of the 116 countries for which this indicator is calculated, France ranks eighth, behind in particular South Korea (1st), the Netherlands and Germany. Even though the quality of the information published in France is open to criticism (see above), it is worse in most other countries. Tax expenditures constitute everywhere a blind spot in public policy, where numerous measures benefiting specific categories of households or firms may be found.
To continue improving information on tax expenditures and to mitigate the cross-country comparability problems mentioned above, the CEP has begun publishing country reports written by national experts following a standardised outline. The first, published in July 2024, focuses on the Netherlands and was written by a former deputy director of tax legislation at the Dutch Ministry of Finance. It shows in particular that the cost of tax expenditures in that country can be estimated at 8% or 15% of GDP depending on the reference norm used. The gap between these two estimates is due in particular to whether or not an “earned income tax credit” is included among tax expenditures; this credit would roughly correspond in France to a combination of the family coefficient, the personal income tax rebate, the RSA and the in-work benefit (prime d’activité).
A second report, published in October 2024, focuses on India. The third report, published in November 2024, focuses on France and was written by the author of this note. It is available online in French and in English. Additional reports have since been published on Brazil, Morocco, the United Kingdom, Colombia, Mexico and Zambia.
The following media outlets are mentioned in this note:
[1] A tax reduction cannot exceed the amount of tax due before the reduction. A tax credit may exceed it and, where applicable, the difference between the tax credit and the tax due is reimbursed by the State to the taxpayer.
[2] An Excel file showing the cost of VAT-related tax expenditures for all public administrations is nevertheless annexed to the report.